
Store Development
Why Your Portfolio Rollup Lives in a Spreadsheet
The tracker a leadership review runs off is usually rebuilt by hand every week, and it drifts from reality the moment it is saved. A live cross-project view changes that.
The rollup that is out of date before the meeting starts
Every multisite program has a version of the same document. A master tracker, usually in Smartsheet or Excel, that lists every project with its open date, its phase, its budget, and whoever owns it. It is the thing leadership reviews on Monday, and it is almost always out of date by the time they read it.
The reason is mechanical. Nothing feeds that tracker automatically, so someone rebuilds it before each review, copying status, dates, and budget numbers out of dozens of individual project records into one grid. The moment it is saved it starts drifting, because the projects keep moving after the copy is taken. A permit lands or a date slips, and none of it reaches the spreadsheet until the next manual pass.
That lag is easy to underestimate. Quickbase's Gray Work Index found that up to 70% of workers lose as much as 20 hours a week chasing information across fragmented systems, and that only about 10% are extremely confident in the accuracy of the project information they work from. On a rollout that shows up as a portfolio owner who spends part of every week reassembling a picture the platform could have drawn, and a leadership team half-debating whether the numbers in front of them are current.
Why the spreadsheet breaks at multisite scale
A spreadsheet is the natural first tool for this, and it holds up fine for a handful of projects. The strain shows once the portfolio grows and the tracker becomes something a team maintains by hand with no end in sight.
Accuracy is the first thing to go. Decades of research by Raymond Panko at the University of Hawaii, the most-cited work on the subject, found that roughly 88% of spreadsheets contain errors. A portfolio tracker is a large spreadsheet edited under time pressure by whoever is free, which is close to the worst case for that rate. A transposed number, or a formula that stopped covering the rows added last month, can sit unnoticed while leadership makes calls on it.
The manual work itself piles up on top of that. Deltek's Clarity study of architecture and engineering firms found that more than 75% still rely mostly on manual data entry and spreadsheets to manage project delivery. Every one of those keystrokes is a chance for the copy to diverge from the record it came from, and the gap only widens as the portfolio does.
Both of those sit on top of a bigger issue. The tracker lives outside the system where the work happens. Access is all or nothing, so either everyone sees every project or the team splinters into separate copies. The grid shows whatever was last pasted in, and a reorganization that renames a column can quietly break the rollups underneath it. A reporting layer disconnected from the data it reports on falls behind no matter who keeps it current.
What a live cross-project view looks like
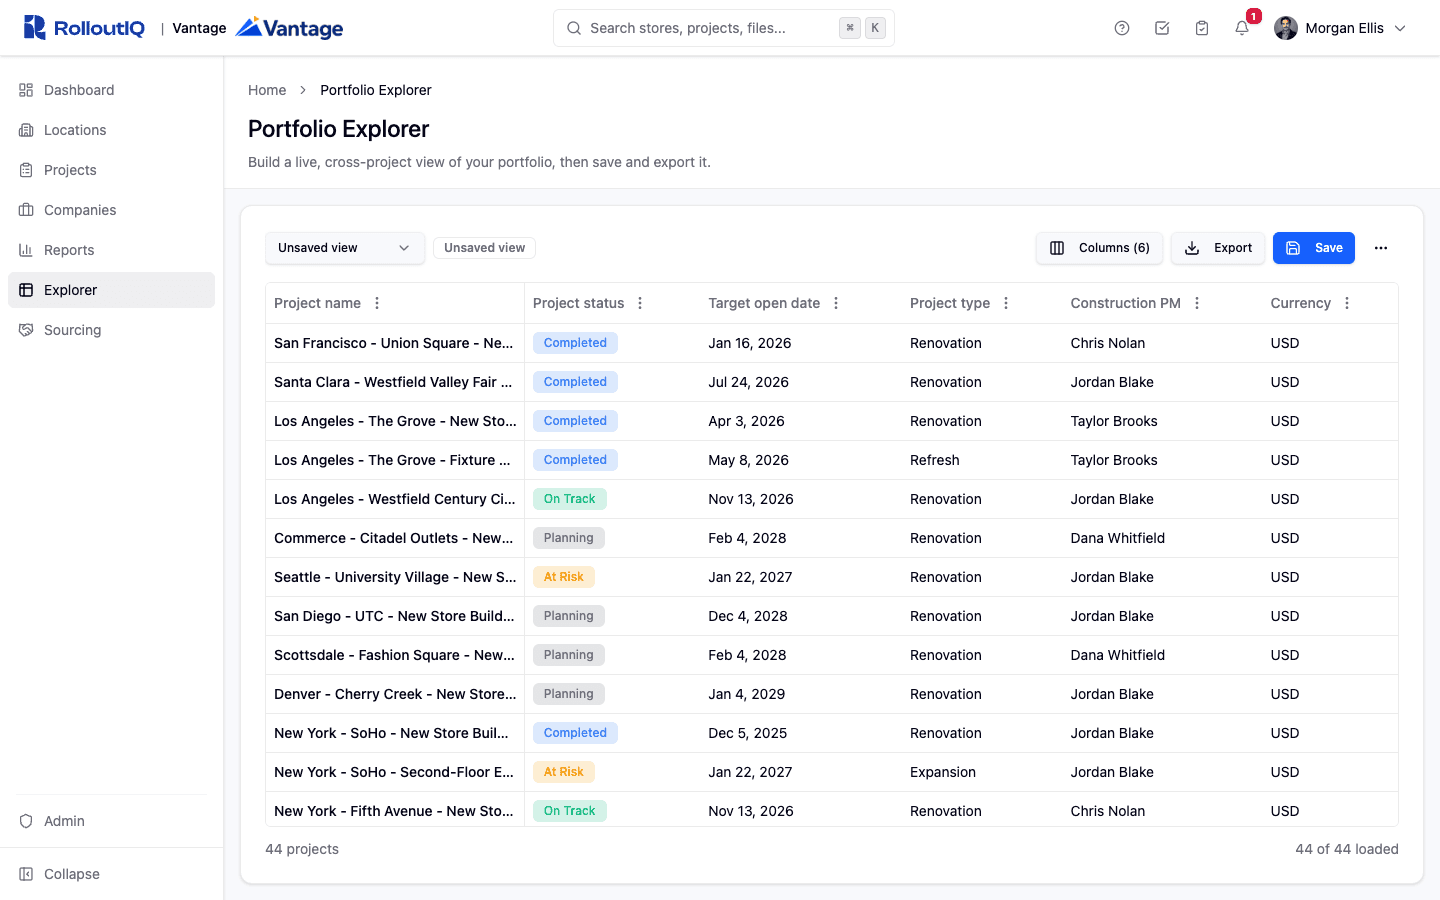
The fix is to stop maintaining a second copy and read the portfolio directly from the system that already holds the work. In practice that means a live cross-project grid, one row per project, built from the data the platform already tracks rather than re-keyed from it.
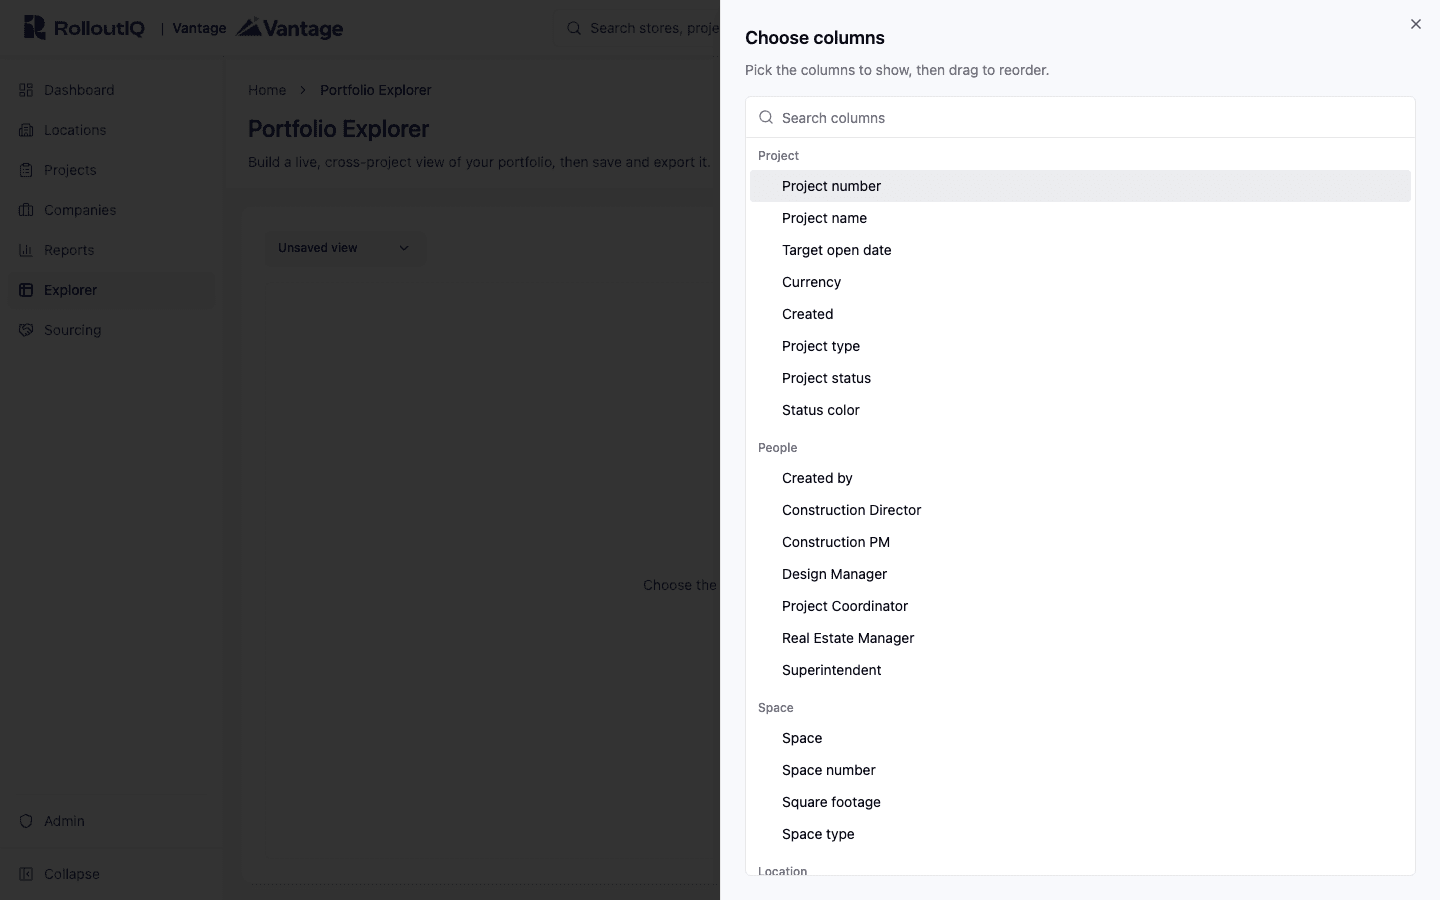
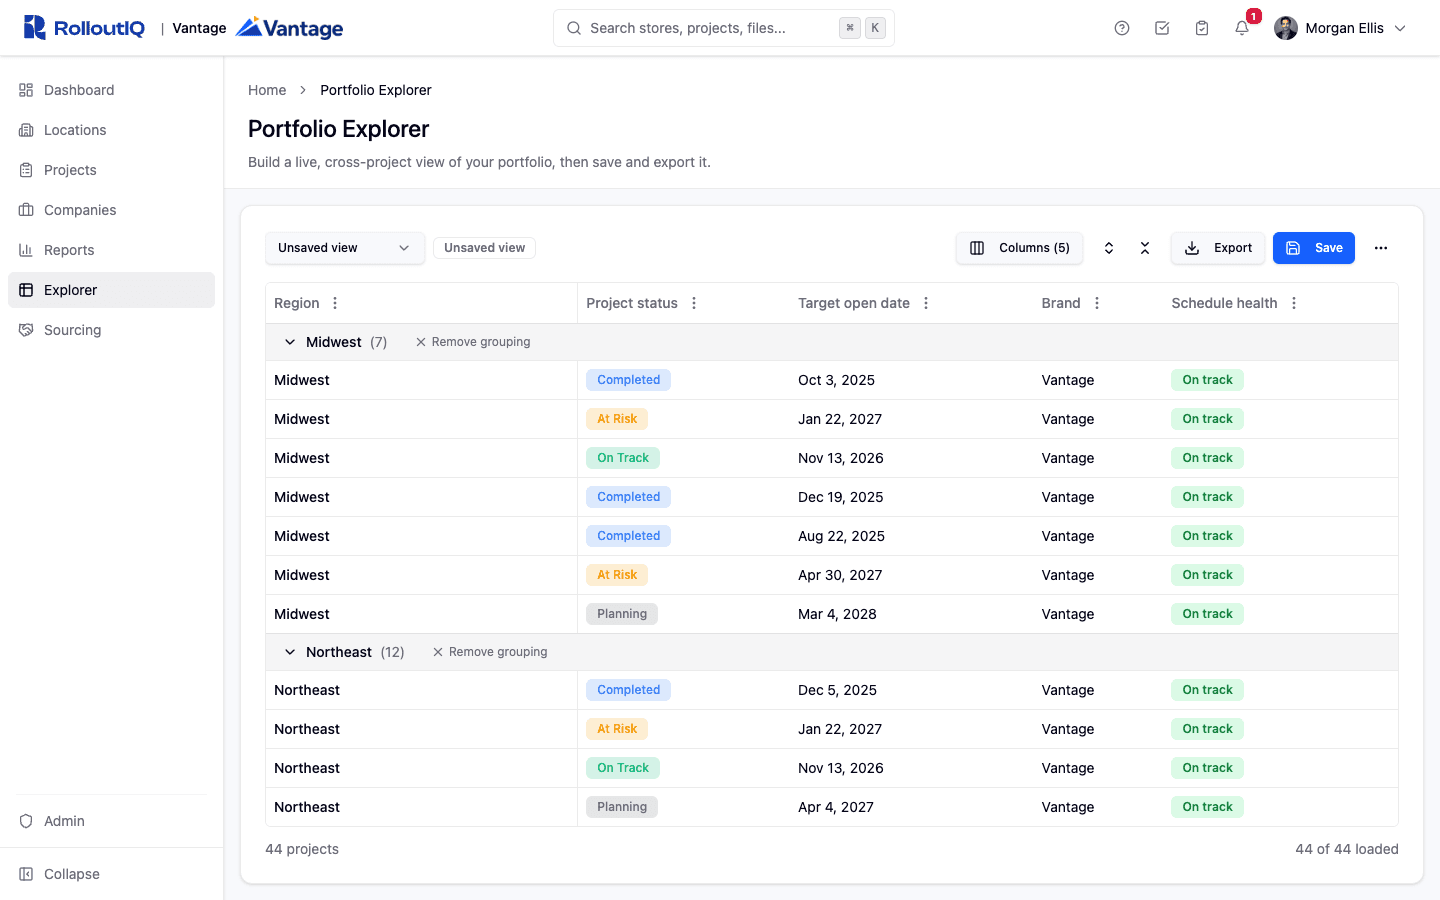
The useful version of this lets the reader choose the columns. A real-estate director builds a view around open dates, landlord milestones, and lease status. The construction lead throws most of that out and keeps schedule health, construction start, and open-work counts. Both are reading the same underlying projects, one row each, with a different set of columns drawn from the same source. Filtering, grouping, and sorting run across the whole portfolio, so a hundred projects collapse into a handful of regions or phases on demand.
What matters more than the column list is access. A view that reads from the system of record scopes every row to what the viewer is allowed to see, so a shared layout never leaks a project a teammate should not open, and nobody keeps a private copy to route around permissions. The numbers also have to be honest about what they are. A budget column reading from the platform shows movement, the approved baseline against the current revised figure, and it never pretends to be spend the system has no invoice data to support.
This is the shape RolloutIQ took with Portfolio Explorer. You build a view by picking columns across schedule, budget, team, and open work, group and filter it, save it as a personal or shared layout, and export it when finance wants a spreadsheet, all reading live from the projects themselves.
The Monday review, without the rebuild
Take the review that used to open with a rebuilt spreadsheet. The construction director loads a saved view built for exactly this meeting, filters it to the region on the agenda, and groups it by schedule health so the at-risk projects sit together at the top with a count on the header. The grid was current when it loaded, because it reads from the projects themselves, so nothing had to be assembled beforehand.
When finance asks for their copy, the same view exports to a spreadsheet, filters and all, prepared in the background with a download link when it is ready. That file is a snapshot for the record, and the live view stays the working source, so the next review starts from live data again and the weekly rebuild stops happening.
What to ask of any portfolio-reporting approach
This does not depend on a particular product. A team can ask a short set of questions of whatever it uses to report across a portfolio, a spreadsheet included, and the answers show how much drift it is carrying. RolloutIQ built Portfolio Explorer around these questions, and any tool that answers them well will hold up as the portfolio grows.
- Does the rollup read from the system where the work happens, or is it re-keyed from it? Re-keying is where the drift and the lost hours come from.
- Is every row scoped to what the viewer is allowed to see, or do you keep separate copies for separate audiences?
- Can each role pull the columns it needs from the same source, without a new tab or a new tracker?
- Do the money columns say plainly what they are, budget movement against actual spend, so nobody reads a figure as something the system cannot back?
- When you export for a board pack, is that file a snapshot for the record, with the live view still the working source?
Sources
The industry figures in this article come from the following public sources.
- Quickbase, Gray Work Index - https://www.quickbase.com/news/press-releases/report-70-percent-of-workers-lose-20-hours-a-week-to-fragmented-systems
- Raymond R. Panko, University of Hawaii, Spreadsheet Research (SSR) - https://panko.com/ssr/
- Deltek, 46th Annual Clarity Architecture & Engineering Industry Study - https://www.deltek.com/en/about/media-center/press-releases/2025/what-the-46th-annual-deltek-clarity-ae-study-reveals-about-the-industry

Written by
Nariman Shariat
Founder, RolloutIQ
Nariman has spent about 20 years opening stores, in the seat between the landlord, the architect, and the general contractor, across some of the largest retail and workplace fleets in the country. Along the way he built the internal platform that ran store development across a fleet, then rebuilt the same idea company after company. He founded RolloutIQ to give multi-site development teams the single source of truth he kept having to build by hand, and writes here about the work of opening and remodeling stores at scale.
More about NarimanKeep Reading
Related Articles
Continue exploring best practices for store development and construction management.

The Weekly Status PDF Is Lying to Your Execs
The weekly status PDF reaches your leadership team looking authoritative, and it rests on data most people do not fully trust. A look at why executive reporting should be live and honest about what it cannot see.

Why Multi-Site Development Outgrows the Spreadsheet
A weekend-built tracker runs most store development programs at first. Here is what breaks as the portfolio grows, from version confusion across drives to rollups that collapse on a reorg.

The Single Source of Truth Is What Lets a Program Scale
Most teams read single source of truth as one system, then run a consolidation project that does not fix anything. The useful definition is narrower, and it decides whether a program survives its own growth.
Ready to Build Smarter?
See how RolloutIQ™ can streamline your retail and multi-site rollout program. Book a personalized demo with our team.