
Analytics
Portfolio Reporting Your Team Builds Itself
Rollout programs get reported out of side spreadsheets and BI dashboards that someone rebuilds by hand every week. RolloutIQ™ Analytics puts that reporting inside the system where the work happens. Your team builds Reports out of charts, numbers, maps, timelines, and grids over every store, space, and project, shares them with the roles that need them, and every number opens into the records behind it.
The Problem
Why Reporting Becomes the Bottleneck
When the portfolio is reported from copies of the data, the numbers leadership reads are already out of date.
The Master Tracker Lives Outside the System
Status, dates, and budgets get copied out of dozens of project pages into a spreadsheet or a BI tool. Every update has to be copied over by hand, and the tracker falls behind the projects.
Numbers Mean Different Things in Different Decks
When each report defines "at risk" or "budget growth" its own way, the review spends its time reconciling figures before anyone decides anything.
Sharing Means Exposing Too Much
A dashboard built for the executive team cannot go to a regional manager or a brand lead without someone building a second, trimmed copy for them.
What RolloutIQ™ Does
What Analytics Does
Analytics reads live portfolio data, so a Report is current every time it opens. A shared Report carries its layout to each viewer, and each viewer sees only the stores, spaces, and projects they can already open.
Reports Built From Tiles
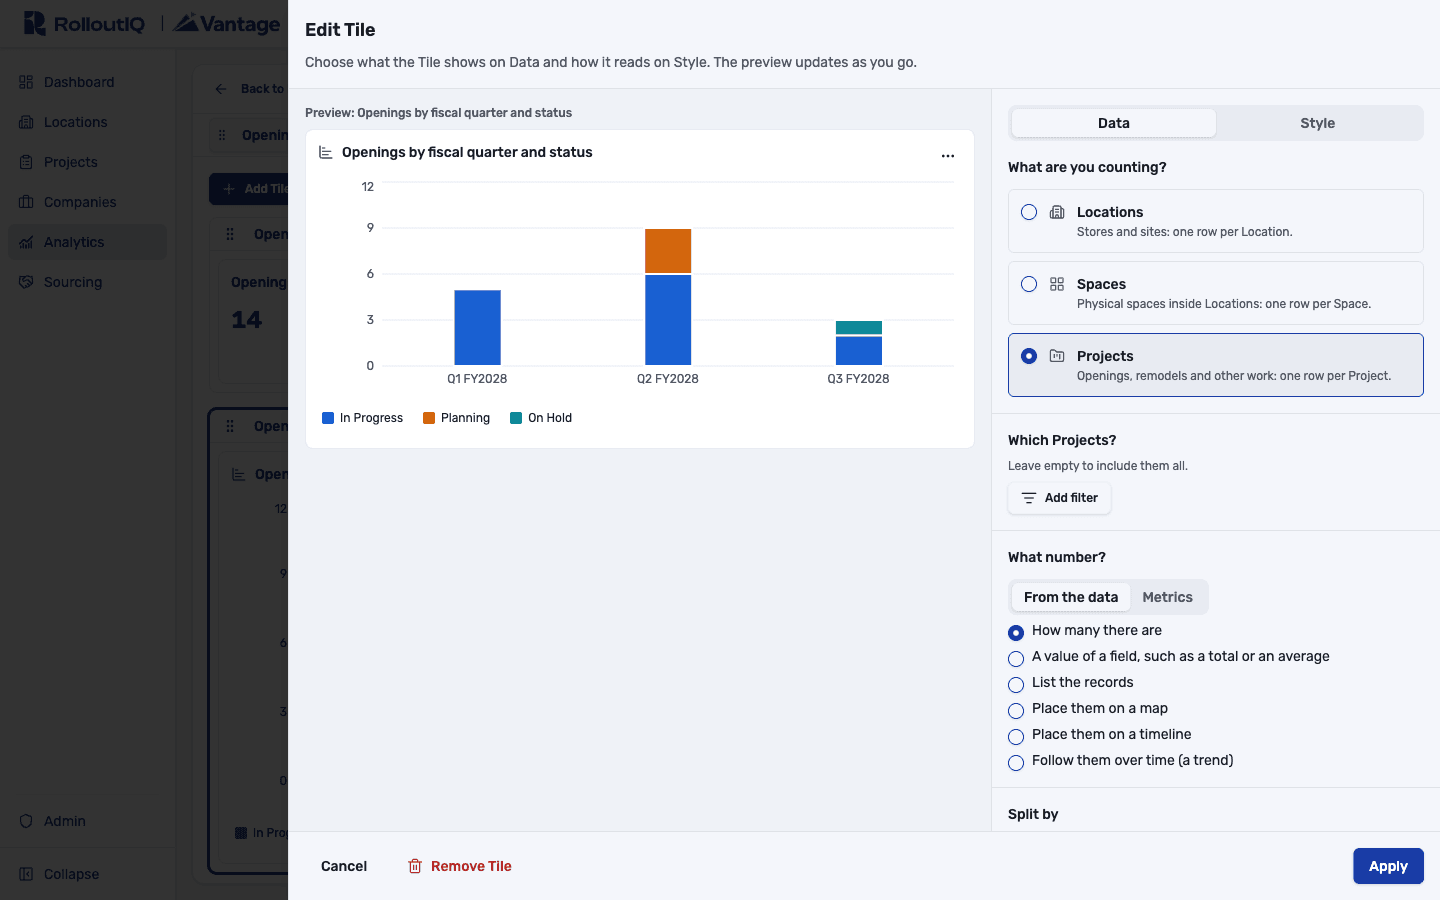
Build Reports in Analytics Studio out of tabs of Tiles: headline numbers, bar, line, and donut charts, tables, maps, Gantts, timelines, text notes, and full-page grids. Each Tile is set up in one panel with a live preview, and every chart has a data table view.
Stores, Spaces, and Projects, Your Fields Included
Report on locations, spaces, and projects, including your own custom fields. A Tile can count what sits under a record, like each store's active projects, or filter by it, for example stores with a project opening next quarter.
Every Number Opens Into Its Records
Click any number, bar, slice, or table cell to see the exact records behind it, each linking to its own page, and take that list to Excel.
Business Numbers With Plain Definitions
Projects at risk, retargeted openings, RFI cycle time, change order impact, and budget movement each carry a plain-language definition, so "at risk" means the same thing on every Report.
Trends Over Time
Chart projects at risk at each month end, or budget totals by quarter, split by status, region, or brand. Trends read from a history of each project that is saved every night.
Your Fiscal Year and Your Colors
Date filters, Gantts, and timelines follow your workspace fiscal calendar. Admins give each region, brand, or market a chart color once, and it looks the same on every chart.
Full-Page Grids for the Whole Portfolio
A grid lists every record with the columns you pick from a searchable catalog. Readers search it, filter a column, and group rows with a count and totals for each group, without changing the author's layout.
Export for the Board Deck
Export a tab as a PDF in portrait or landscape with its filters listed, the whole tab as one image for a slide, or a grid's rows in Excel exactly as you see them. Each export holds only what the person exporting is allowed to see.
Highlights
Inside Analytics
Start from a ready-made Report or a blank one, then shape it in the Studio until it answers the question your review keeps asking.
One panel for each Tile
Choose the records, the number to show, and how to split it, with the suggested chart marked and a preview that updates as you go.
Arrange the Report in the Studio
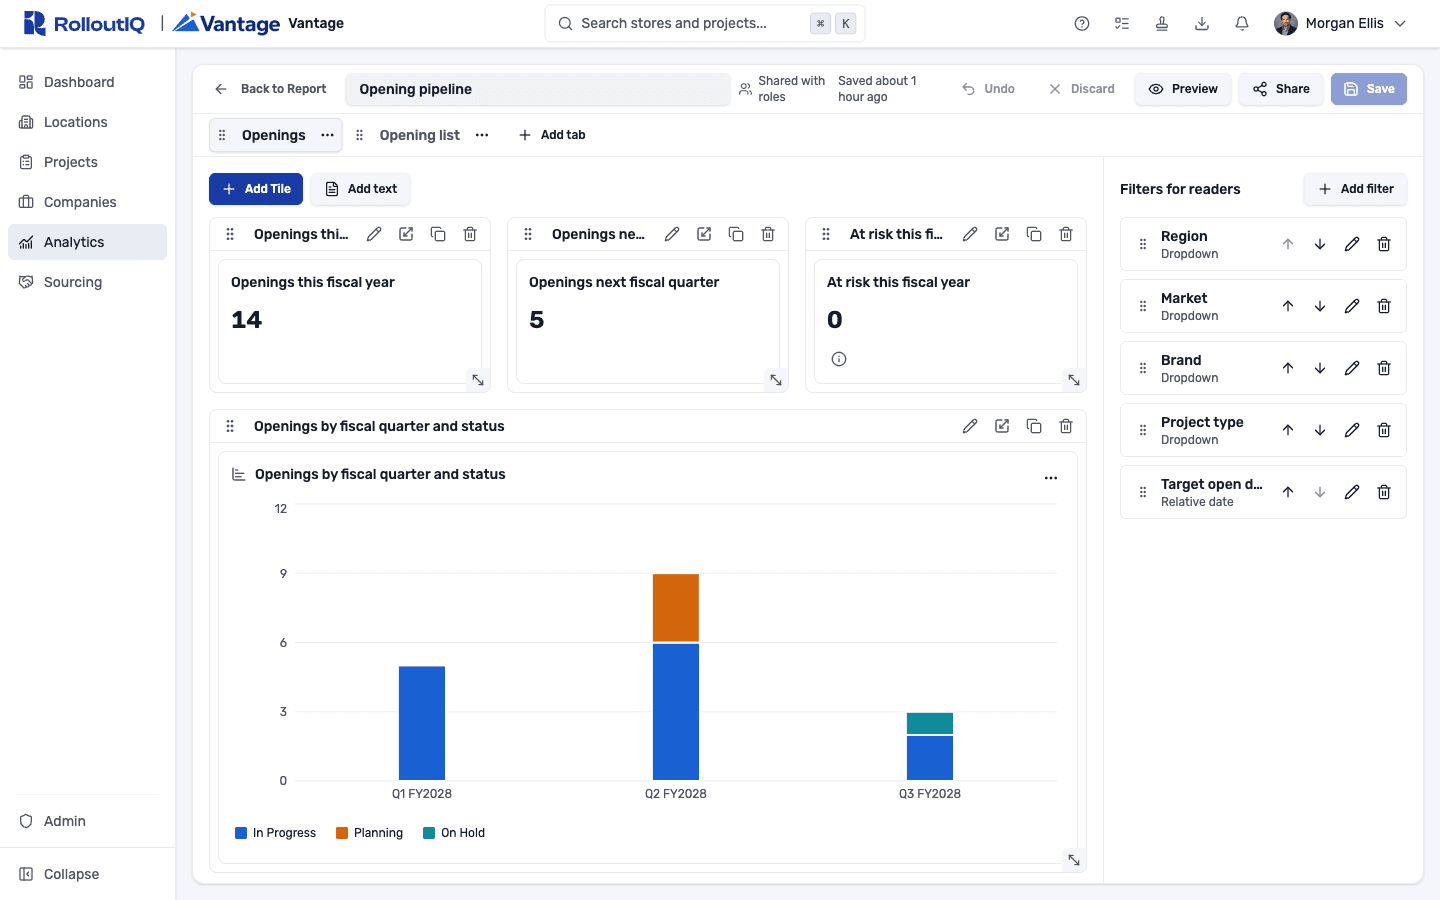
Drag and resize Tiles on a grid, add tabs, and choose the filters readers get, such as region, brand, project type, and target open date.
The pipeline on a map
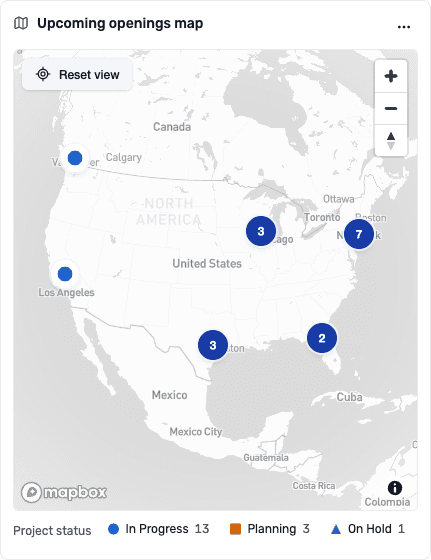
Map Tiles place records at their store address, clustered and colored by status or region, and print with their pins in a PDF.
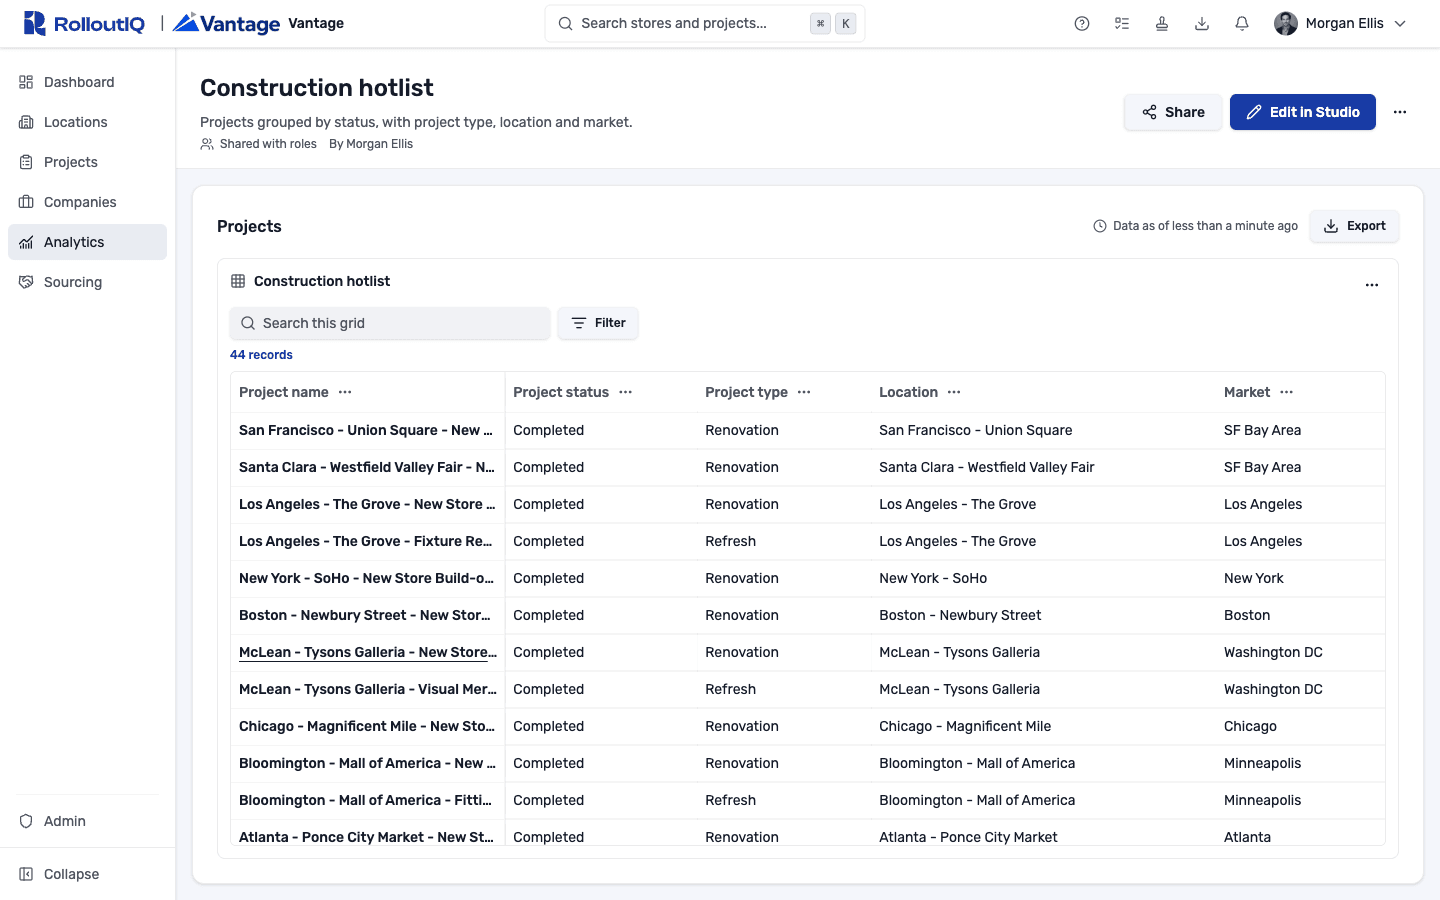
Replace the master tracker with a grid
A grid holds the portfolio one row per record, with the columns your team reports on. Every former Portfolio Explorer view now lives here.
In Practice
How Multisite Teams Use It
Monday Leadership Review
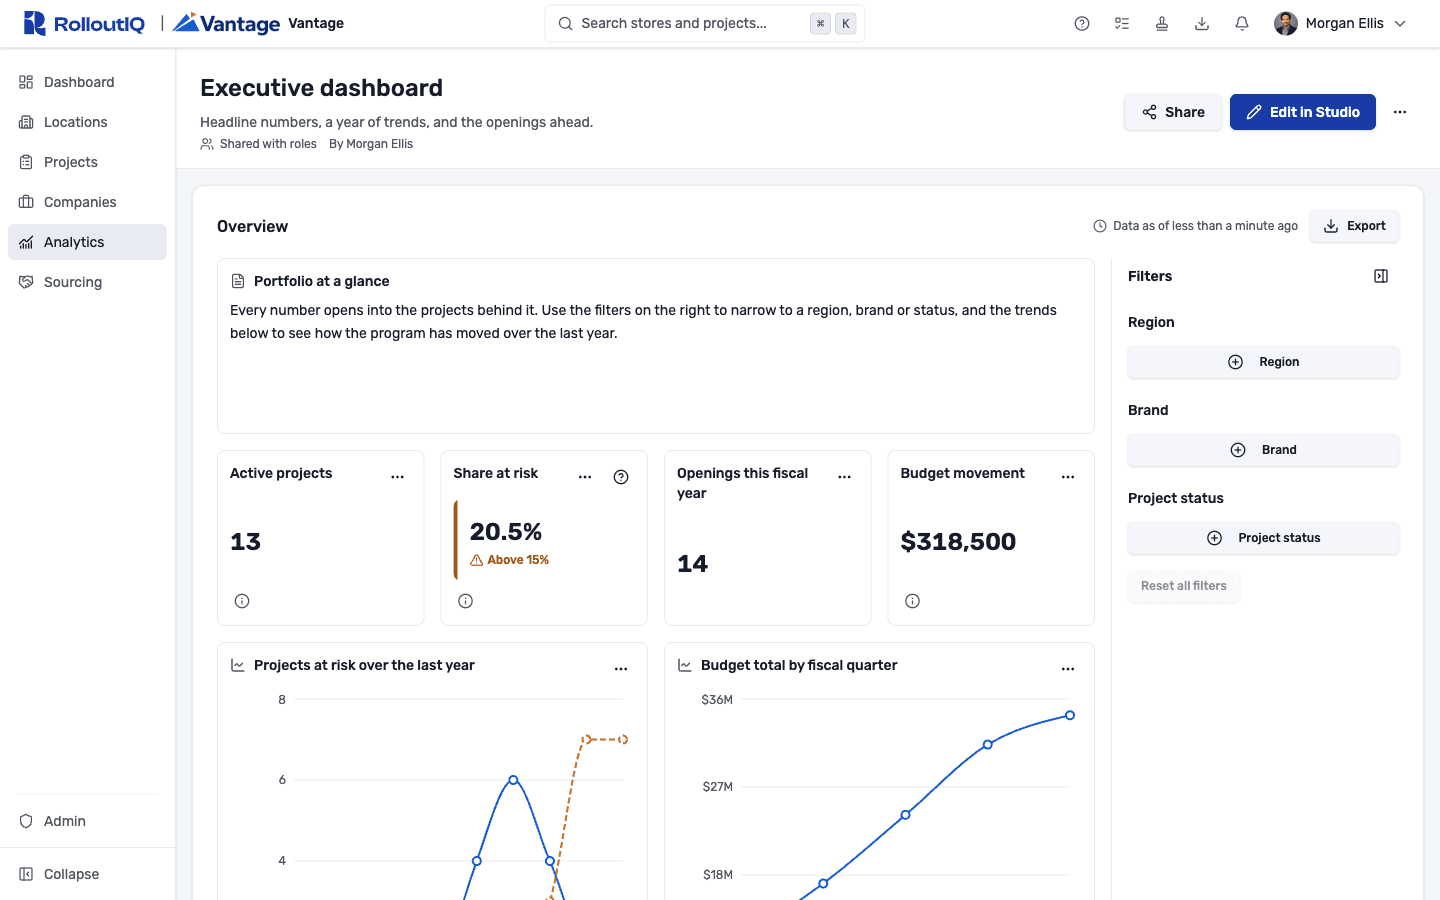
Leadership opens a shared Portfolio Report, filters to their brand or region, and reads active projects, the share at risk, openings this fiscal year, and budget movement, all current when the Report opens.
A Hotlist Per Function
The construction team works from a hotlist of slipping projects. Real estate asks a different question, so it builds a pipeline grid and shares it with the roles that read it.
Retire the Weekly Status Deck
The program manager builds the Report once and exports a tab to PDF before each weekly call.
For franchise groups
A franchisor update from one Report
Give each brand its own chart color and split any number by brand. When a franchisor asks where its openings stand, filter the Report to that brand and send the tab as a PDF.
See RolloutIQ for franchise groupsFAQ
Analytics FAQ
No. Analytics is on for every RolloutIQ™ workspace, new and existing, at no extra cost. A workspace admin can turn it off.
Yes. Each person who opens a shared Report sees only the stores, spaces, and projects their access allows, so two people can read the same Report and see different numbers, both correct for them. Vendors and other outside collaborators cannot open Analytics.
Analytics replaces both. Every workspace was moved over: saved Explorer views became Reports with the same sharing, Reports users got a ready-made Portfolio Report with the same Locations, Progress, Costs, and Quality tabs, and old links and bookmarks open the matching Report.
No. RolloutIQ™ holds approved budgets, change orders, and adjustments, while invoices and payments stay in your accounting system, so budget figures show the approved baseline against the revised budget and say so on the Report.
Yes. An admin can turn on embedded dashboards and show a Power BI, Tableau, Looker, or Looker Studio dashboard inside a Report. Only secure links that ask the viewer to sign in to the BI tool are accepted, and nothing from RolloutIQ™ is passed to it.
Ready to Stop Rebuilding the Status Report?
See Analytics on real store-development data, from the ready-made Portfolio Report to a PDF for your next leadership review. Book a demo with our team.